Compliance Dashboard covers Professional Development Learning Plans, as well as Statutory and Mandatory policies for Leadership & Governance memberships.
The report shows Learning Plans, content and users at user, school and group level.
The information you will see is based on your role, which schools you have access to, and the data from available memberships. For example, if an Leadership & Governance membership isn’t available, the “Policies” column will appear empty, and the Leadership & Governance toggle may be disabled.
1. Accessing the Dashboard
- Select Admin in the top navigation bar
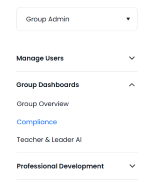
- In the left-hand side navigation, open Group Dashboards and select Compliance. It will appear alongside any other available Group Dashboards (such as Group Overview and Teacher & Leader AI).
- Use the selector at the top of the navigation to switch between group level and any schools that the user manages.
- The report will open and display the Summary tab.
2. Navigation
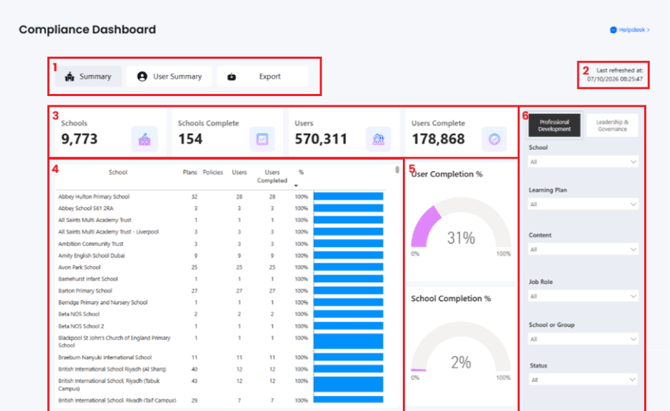
|
Area |
Title |
Description |
|
1 |
Tabs |
Move between pages in the report (Summary, User Summary, Export). |
|
2 |
“Last refreshed” |
The last date and time that the data was refreshed |
|
3 |
Schools / Users |
Totals for how many schools and how many users (across all schools). These will update when a different subscription is selected. |
|
3 |
Schools / Users Complete |
The total number of schools or users that have reached compliance. |
|
4 |
School table |
For each school: how many Learning plans, Policies, total users, how many of those users are compliant, and a compliance percentage total (with a bar for quick comparison). Click a column header to sort - or click a single school to filter. |
|
5 |
User & School Completion % |
Dials showing the proportion of users and schools that have reached compliance. |
|
6 |
Filters |
Filters that apply to every visual on the page. |
3. Moving between subscriptions
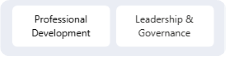
To move between Professional Development and Leadership and Governance, The two buttons at the top of the filter panel change how compliance is calculated in the report.
By default neither will be specifically selected and the data will show both, if you are looking for a specific subscription, you would click on the subscription name. You would click it again to unselect it.
4. How completions are calculated
Policy Completion
- A policy counts towards completions once every assigned user has read it
- Only Statutory and Mandatory policies are included
User Completion: Professional Development
- has completed all content in every assigned Learning Plan
User Completion: Leadership & Governance
- has read every policy assigned to them
School Completion
- A school is counted as complete only when all users are completed
5. Filters
Filters are dynamic, so the options available may depend on other filters. Filters apply to every visual on the page and are instantly applied.
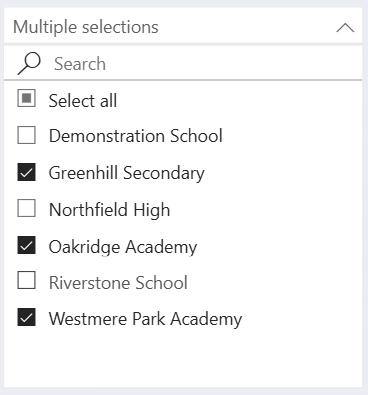
School Filter
Multi-select dropdowns to select/deselect all schools or search for a school to add/remove.
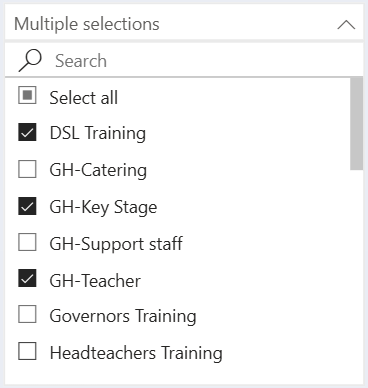
Learning Plan Filter
Multi-select dropdowns to select/deselect all Learning Plans or search for a Learning Plan to add/remove, Learning Plans do not contain policies.
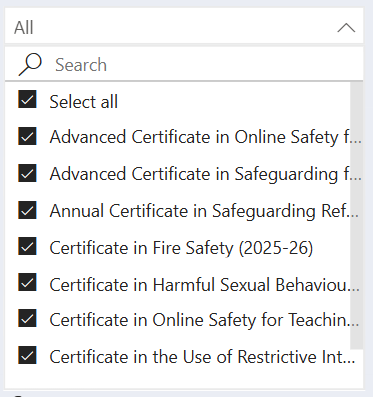
Content Filter
If looking to compare compliance for a specific content title (e.g. from within a Learning Plan) across multiple schools in a group, these can be selected here.
Policies are included in this list.
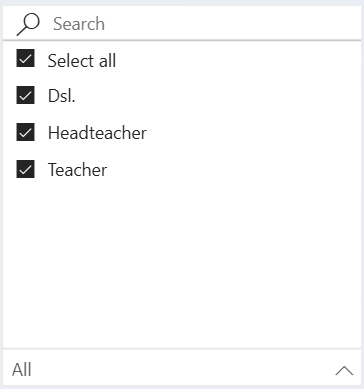
Job Role Filter
Filtering by specific job roles is a powerful way to monitor compliance horizontally across the organisation.
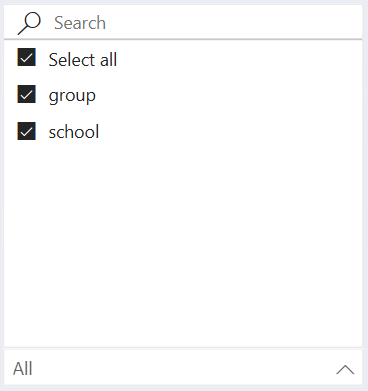
School or Group Filter
Easily switch between schools or groups. Especially useful for multi-access users, when they are in multiple groups.
Status Filter
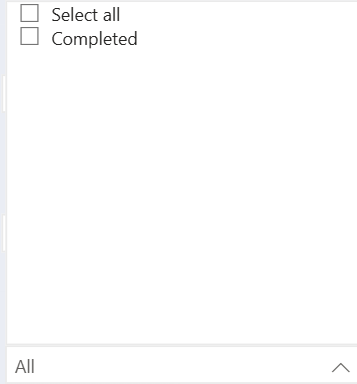
Switch between only showing completions – or including users and schools that aren’t compliant as well.
6. User Summary
The User Summary shows two lists side by side, with a filtering panel on the right. Filters work in the same way as on the main summary page.
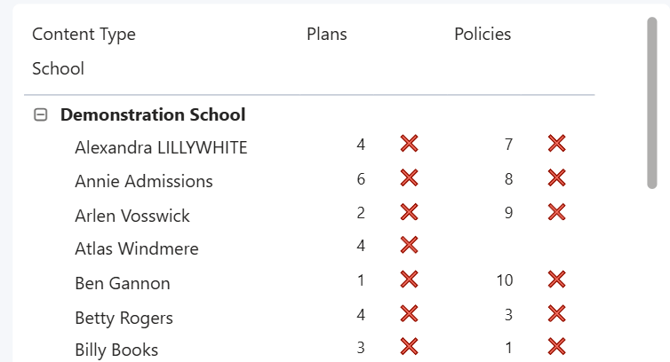
The list on the left shows users grouped by school, with the number of plans and policies assigned to each user. A tick or a cross shows whether they have completed the Learning plan or policy.
The content list on the right groups content by learning plan with a tick or cross for each item. A tick or a cross show whether they have completed all content within that LP or policy.
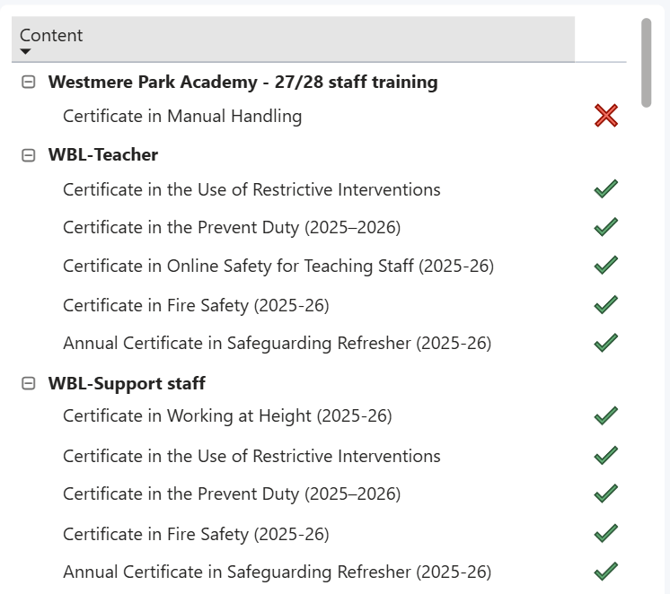
Clicking on a user in the list on the left will filter the Content list on the right.
Plans and content are either complete or not complete, with no progress percentage.
7. Export
You would export the infomation from this tab, This page lists one row per user/content item.
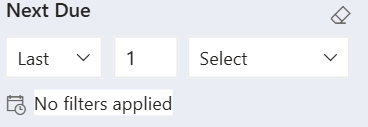
The filters can be used to generate the report information. The Export tab has a Next Due date filter for finding content due within a chosen period – forwards or backwards.
If both source buttons don't fit on this tab, use the arrow to scroll between Professional Development and Leadership & Governance.
How to export a filtered view
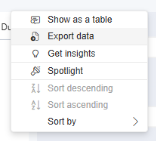
- Hover over the table to display 'more options' and then press the 3 dots

- Select the Export data option:
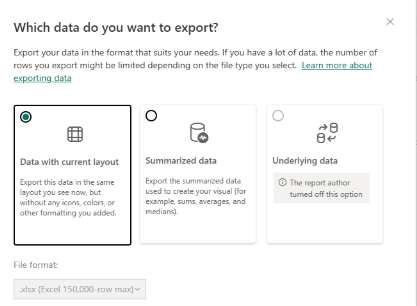
- Select the type of data (up to 150,000 rows). In most cases “Data with current layout” is the best option:
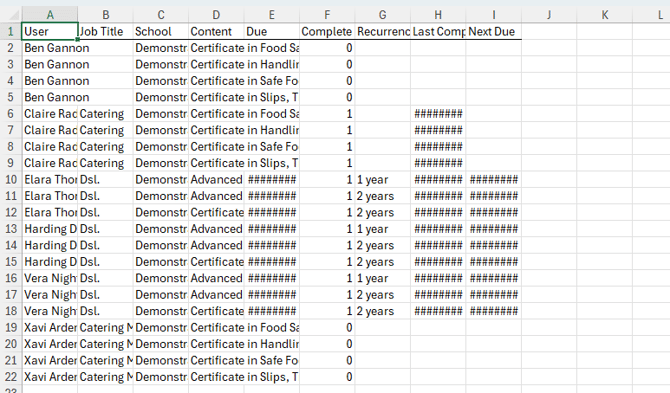
The system will create an Excel file “data.xlsx”. An additional row on the last line describes which filters were applied to generate the report:
What does each column in the report show?
|
Column |
Description |
|
User, Job Title, School |
Who the compliance relates to |
|
Content |
The learning plan, content item, or policy |
|
Due |
The date the content was due to be completed by |
|
Complete |
1 = complete, 0 = not complete |
|
Recurrence |
How often the content must be repeated, for example 1 year. Blank if it doesn't recur (i.e. “one-off”). |
|
Last Completed |
When completed (or the most recent completion date if completed more than once) |
|
Next Due |
Last Completed plus the Recurrence period (for example, 5 August 2026 plus 1 year gives 5 August 2027). Blank if the content doesn't recur (i.e. “one-off”). |
8. FAQ's
- Why did completion drop when I selected Leadership & Governance?
Adding policy completion as a requirement means there is more for each user to complete. The total number of schools and users may change, depending on which schools have this type of membership. - Which policies are included in the combined compliance view?
To keep the view focused on critical compliance, only Statutory and Mandatory policies are aggregated into the combined completion metrics. - Can customers see individual user details like job titles?
Yes, the report can bring through full names, emails, and job titles to help administrators identify and group specific gaps in compliance. - Why is a school missing?
Row Level Security (RLS) shows only schools assigned to the user's school group. If a school is missing, please contact us and we can get it looked into. - Why hasn't a recent completion appeared?
Data updates at each refresh. The date is shown under “Last refreshed at” at top right. - How do I get a list of users with outstanding content?
On the Export tab, set the filters (for example “Status” = “Outstanding” and “Next Due” = “Next 6 months”), then choose Export data from the table menu. - Why does an exported row have no content name?
The content item is missing its name in the source data. Can you please report it to us as a data issue - the rest of the row is still valid. - Why can’t I see the Compliance Dashboard, or why is a certain user unable to access?
Group Dashboard access is role-based. It is only visible to SGMs in Group Admin, or to School Managers in School Admin who have been granted multi-school access permissions.